|
all figures |
|||||||||||||||||||||||
|
|
|||||||||||||||||||||||
|
|
|
This page informs about the Main Errors which cause a systematical falsification of Rf-values, serious falsification of some identification procedures and partially the quantitation process. |
|
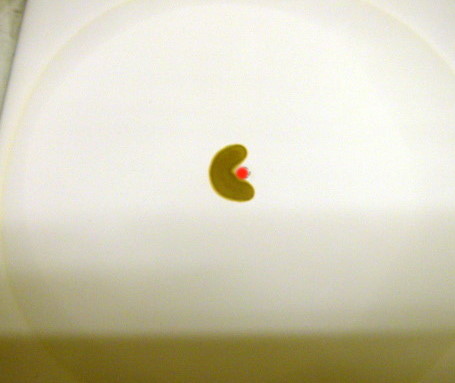
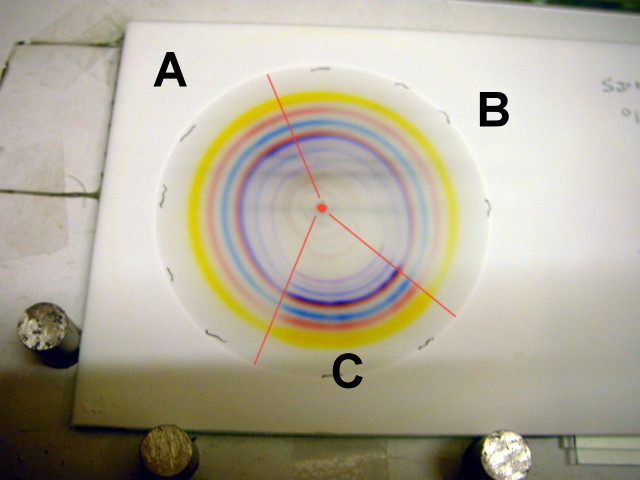
To make the story short: More or less all samples given to PLC’s are solutions of non or low volatile substance mixtures. The used sample solvent is often quite volatile, often enough polar like methanole, more rarely these may be silicone oils, aromatic hydrocarbons, methylene chloride. Non volatile sample solvents are not as critical as volatile, especially polar ones. a) Heat treatment of a raw PLC plate - let say 10 minutes/110 degree centigrade d) very rarely now a final hair dryer treatment of the sampled plate short before the run. Whats wrong and what is missing in these treatment steps: To a) The water content in silica gel based plates is of strong infliuence onto the final separation polarity and on several specific Rf relations of differing substances. The water desorption is slow, water sorption from environmental air is fast and the constancy of a desireable water content in the layer is questionable. There is normally no uniformity of the water content througout the layer thickness. Years of quantity and time controlled water tests on and in plates of very differing quality showed: only 15 to 20 minutes lasting flowing gas treatments directly over the layer can result in a qualified water content value. Mostoften a water content minimum is needed to reach qualified separations and Rf (or in µ-PLC: rel. Pr values). The µ-PLC specific gas flow treatment using a micro gas pump which takes the air (or gas like nitrogen / carbondioxid etc) at the pump inlet and blows this gas in a flow of about 2 litre/min onto the glass plate covered plate center allows top repeatability. As the whole µ-PLC equipment plus gas pump fits in a 50 x 50 x 20 cm plastic container covered nearly gas tight we reach an even extreme dry or nearly oxygen free environment immediately prior to the final separation run. Or any water value we want - just with controlled humidity regulators in a plastic container. To b) Non volatile and highly polar impurities are standard in PLC mobile phases or in “HPLC” - quality liquids. Their quality standard is mostoften based only on spectroscopy data. An on plate strict gas flow clean up may even need elevated plate temperatures to get quality standards, but there is in µ-PLC no problem, see the before last figure in this chapter. To c) Depending on what sample solvents are used, here we are confronted with the TOP TROUBLE maker in all PLC modes: the following figures show the worst situation when the sample solvent is for instance methanol and if we do not remove it down to the best possible minimum trace prior to the final run. A short “hair dryer heat up” as mentioned above under d) does not help, only is reason for bad data repeatability and “dirt-add-on”. Study the following figure in its area C - see below - compare with the area A. Realize, that the polarity effect is far larger in plate position at C as one would believe. In the following the point of any area position in the circulare chromatogram is given by a time position like of the hours 3 - 6 - 9 - 12 (o clock) and values in between. The following procedure has been used when preparing the chromatogram A B C below. 1. the plate was cleaned by a run with methanole methylenchloride 1:1 and dried for 20 min. by a 2 L/min air flow through the centre hole covered by the µ-PLC cover glass. 2. the test color sample solved in toluene/methanole 2:8 was placed in a quite thick bow line as seen in figure one below of this chapter. The sample was dryed for 20 min by flowing flush gas from the plate centre under the cover glass. The thick bow was focussed using about 20 µl methanole from the plate centre and the focuss liquid dryed off for about 10 minutes. Position of this first sample: from about 7 up to 12 (o clock). A second portion of the sample solution was positioned as thick bow in the position 4 to 10 (o clock) thus overlapping the first sample bow in the position 11 to 12 (o clock). This second sample was focussed by about 20 µl methanole and dryed for about 10 min under flowing gas. A third sample was given in the position from 4 to 7 (o clock) next to the plate centre but NOT DRYED NOR FOCUSSED. 3. Now the separation was started at 20 degr. centigrade with 100 % toluene. After 9 min run time the plate was dried under 2 L/min flowing gas at room temperature for 15 minutes - see figure A B C below. The plate quarter area A shows a standard test color circle chromatogram. There is no visible difference to the chromatogram quarter B and in the OVERLAP region there we see: sample at A equals sample at B. Halve of the plate area at C however shows the trouble: due to the NOT removed sample solvent we see a dramatic falsification of the Rf (or Pr) data, all are MUCH too large as compared to data in area A or B. Because of the missing focussing we also see a less good separation of substances from blue to yellow BUT; unexpectedly: the partial overlap areas tell: no differences of the substance type between A and C or B an C because the Rf. resp. Pr-values move long before the sampling position in C towards the high values caused by the sample solvent. NOTE: these are side effects. The liquid sample could not touch the regions from 4 to 3 (o clock) or from 7 to 9 (o clock). We needed only a few seconds time for sampling at C and starting the chromatography run without any focus or drying step. So it must be a sidewards mix of liquid traces from the sample solvent and may be in addition a transfer of sample solvent vapor from the position at C towards the 9 (o clock) and the 3 (o clock) position which made this strong position change of the substances. Now forget the circular µ-PLC concept and consider a linearly position sampling in multi sample series. Let use sample solvents which have a certain vapor pressure. Do not use focussing and do not use a careful total removal of sample solvent traces prior to the final chromatographic run. Do not use long sample lines. Keep them short in order to get as much as possible samples onto the plate. You receive plenty of information, but falsified. Here are the two figures: NON FOCUSSED raw sample spot sizes and the A-B-C - chromatogram trouble caused by not completely removed sample solvents:
|
|
|
||||||||||||||||||||
|
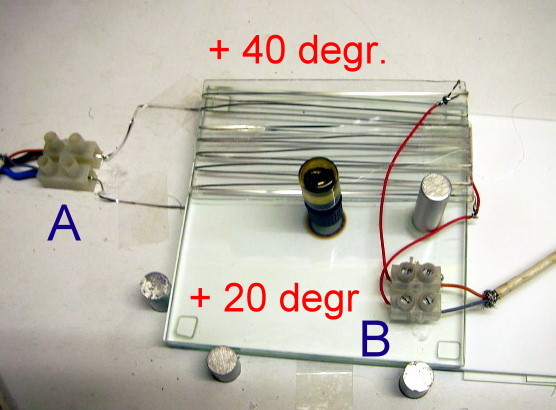
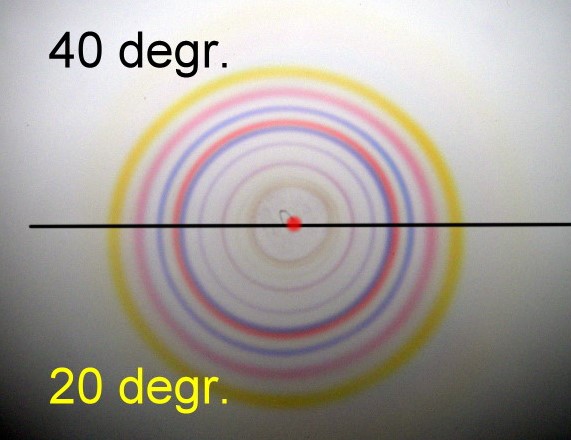
What about the temperature effect in PLC ? It is quite easy to install temperature fields in the µ-PLC plate layer. Let a 50 x 100 mm glass plate carry heat onto a µ-PLC plate by a series of parallel electrical resistance wires and heat up the cover glass plate in the same position by the same concept. This produces an enough homogene HEAT FIELD in the upper 45 x 100 mm large PLC plate, which can easily be adjusted to 40 degree centigrade versus the lower plate part of 50 x 100 mm size as seen in figure three of this chapter. About 3 watt per heating system does it We sampled one color test sample circular around the plate centre, focussed, dried, focussed and dried again. Now we started the separation with a one single substance solvent - in this case toluene. Besides very small relative Rf resp. Pr changes absolute and relative we could not realize anything strong especially NOT at the quite steep temperature border line 20 into 40 degr. centigrade. Things may change with mobile phase mixtures of quite differing polarities like methylene chloride / ethanol etc. This will be studied later. See here the µ-PLC heat field “equipment” and the test chromatogram. |
 |
|
A : Power to a 50 x 100 mm large position of under the PLC plate |
 |
||
|
Circular heat field chromatogram with a single substance mobile phase. |
||
| [Home] [Introduction] [Contents] [µ-PLC pictograms] [Multi Integration] [µ-PLC helps HPTLC] [Main errors in PLC] [Trace anal. by µ-PLC] [TLC HPTLC pictogr.] [Making a µ-PLC instr.] [PLC literature] [sel. Summary] [Balaton Papers] [Basel-Paper-2011] [3-Phases-Chrom] |


